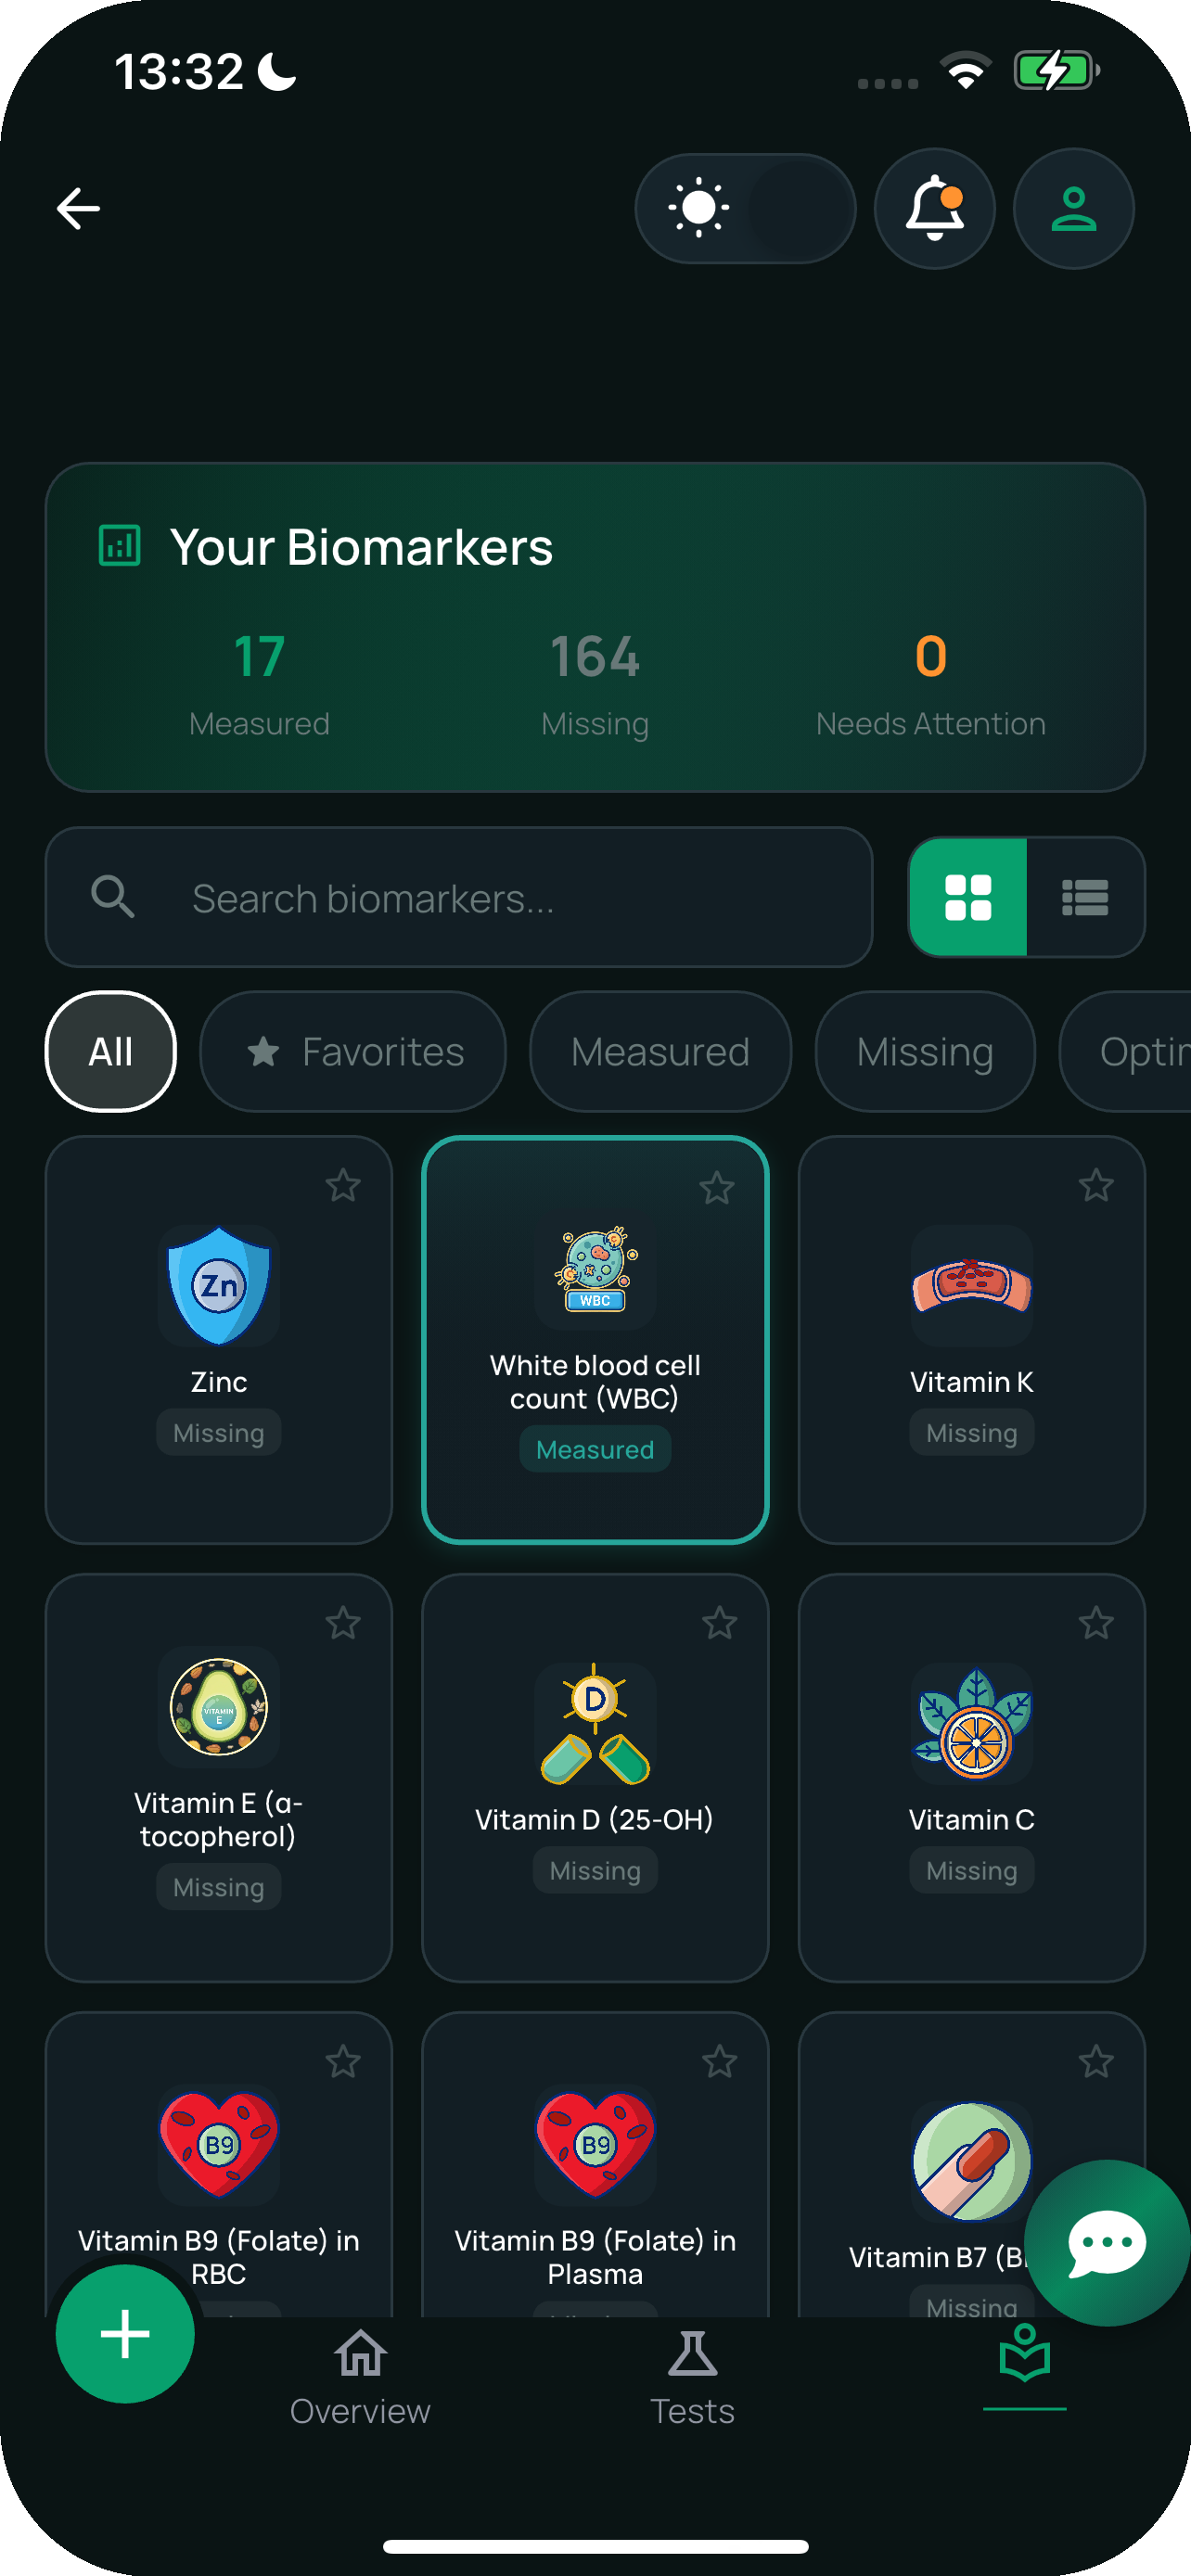
Lab results often arrive as separate PDFs with different layouts, names, and units. I built Health3 to import those reports and organize the values into a biomarker history that people can browse on their phone.
I designed and built the mobile app, document-processing pipeline, and backend. These notes explain the path from an uploaded report to a displayed value.
Start with the report the user has
Requiring people to retype results would make each import another data-entry task. I chose document import as the starting point, with a processing pipeline that separates text extraction from matching values to biomarker records.
Report formats and scan quality vary. Supporting an upload does not mean every field will be extracted correctly; each transformation needs to be inspectable against the source document.
Core Features at a Glance
- PDF lab-report import: drop in a multi-page report, get back structured per-biomarker values with units normalised
- Biomarker library with hundreds of biomarkers, plain-language explanations, normal ranges, and trend context
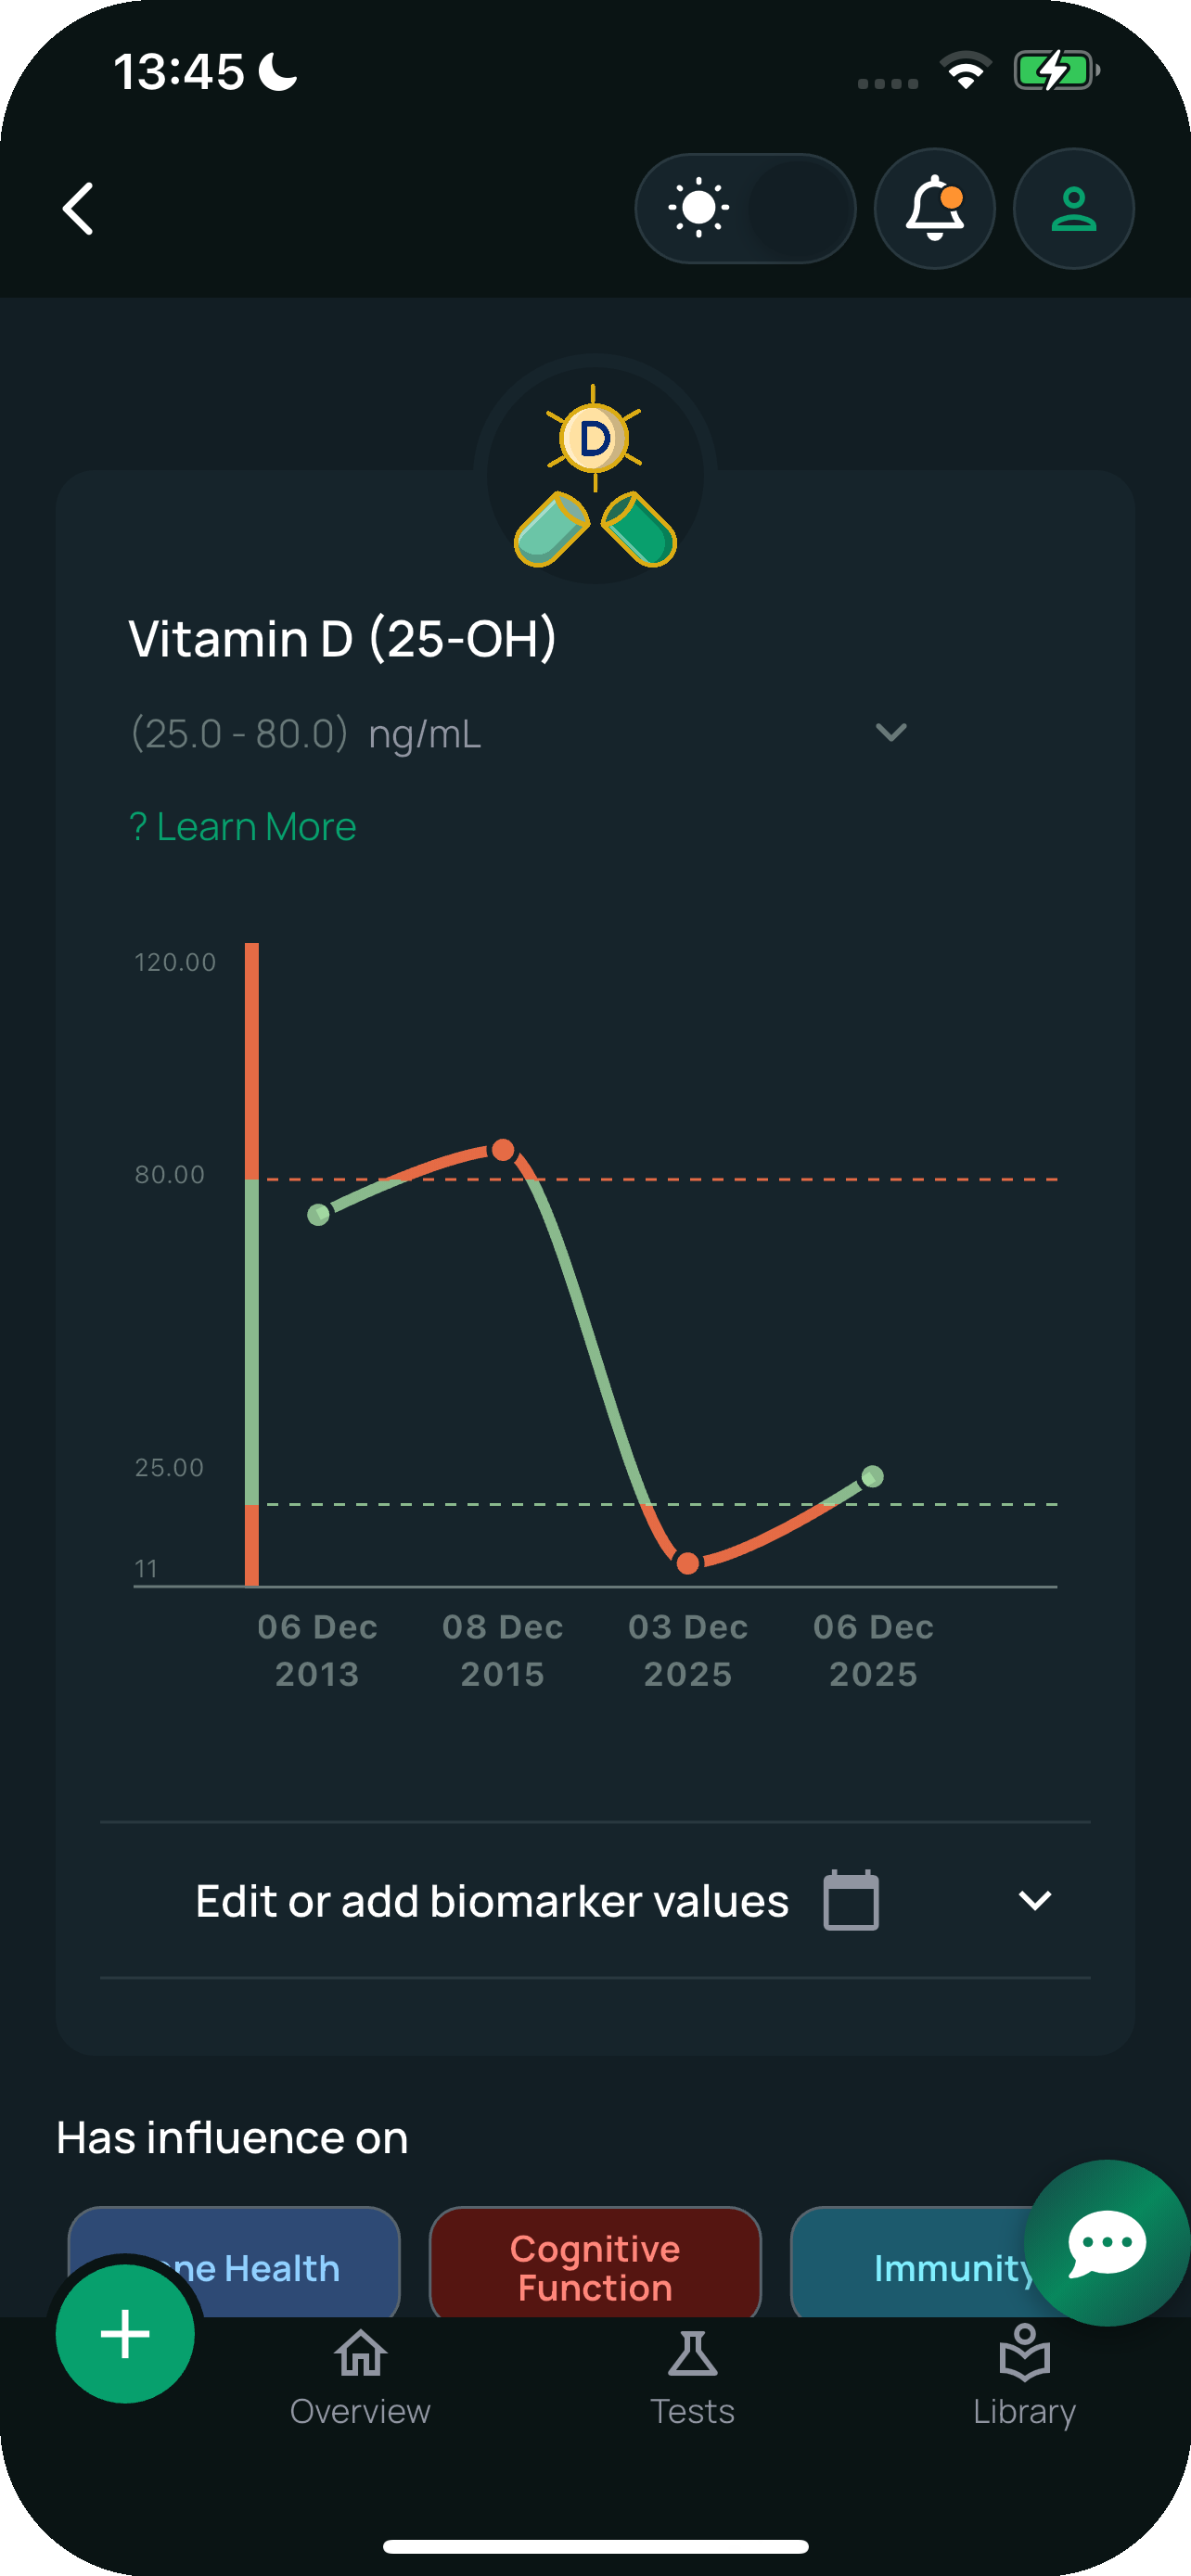
- Time-series tracking so every imported result feeds into the same per-biomarker chart, and trends emerge across years
- Unit conversion at runtime: mg/dL ↔ mmol/L (and the equivalents for every other panel) handled per biomarker, not globally
- User-specific data access: scoped report uploads and database policies around each user’s results
- Topic-level deep dives: biomarker clusters explained in context (lipid panel → cardiovascular framing, glucose + HbA1c → metabolic framing)
Why Flutter Was the Pragmatic Choice for Health-Data UX
Health3 is the kind of app where the visual quality of a chart matters as much as the data behind it. A confusing chart makes a health app harder to trust. I chose Flutter for two reasons: native-quality rendering on both platforms, and the ability to ship the same chart code on iOS, Android, and (eventually) web.
Flutter gives me a shared rendering and interaction model for the charts on iOS and Android. That reduces duplicated interface work. Performance still depends on the chart implementation, data volume, and device, so it needs testing on actual release builds.
Code Generation Where It Helps
I leaned into Dart's code-generation ecosystem: Freezed for immutable models, Riverpod for type-safe dependency injection, JSON Serializable for the API layer. The build step pays for itself the first time a backend schema change surfaces as a compile-time error rather than a runtime null.
The AWS Pipeline: Textract, Bedrock, and Lambda
The hardest engineering problem in Health3 isn't the app. It's parsing the PDF the user uploads. Every lab uses a different template, fonts vary, and many reports are essentially scanned images of paper.
I built a serverless pipeline on AWS:
- Upload to S3 with a presigned URL scoped to the user's session, so the file never travels through my application server.
- AWS Textract runs document analysis, returning the structured blocks of text, tables, and key-value pairs the PDF actually contains. For scanned reports, Textract also handles the pixel-to-text layer.
- AWS Bedrock (Claude on AWS) handles the semantic step: take Textract's raw blocks and map them to the canonical biomarker schema. Bedrock is the layer that knows "LDL Cholesterol", "LDL-C", "low-density lipoprotein cholesterol", and the Spanish "Colesterol LDL" all refer to the same biomarker.
- Lambda orchestrates the steps and writes the structured result back to Supabase.
Separating extraction from interpretation makes the pipeline easier to inspect. Each stage can be tested against the original report. Cost and latency vary with document length, scan quality, retries, and the chosen model; they should be measured on representative documents.
Why Bedrock, Not Direct LLM API Access
Using AWS services lets the pipeline use IAM permissions and a consistent infrastructure configuration. That does not, by itself, establish privacy compliance or guarantee that data stays inside a VPC. Region choice, network paths, service contracts, retention, and audit logging must be configured and reviewed for the particular deployment.
Supabase as the App Database
For everything that isn't the parse pipeline, Supabase is the backend. Row-level security policies enforce that a user can only ever read their own biomarker history, their own imported lab reports, and their own profile. The policies live in the database itself, so authorization has a database-level boundary as well as application checks. That depends on correct policies and tests, and does not protect queries made with privileged service credentials.
Realtime subscriptions push new biomarker results into the running app the moment the Lambda finishes processing. The user uploads a PDF, sees a brief "processing" state, and the time-series chart updates without a manual refresh.
State Management: Riverpod for Calculation Correctness
I chose Riverpod over BLoC, Provider, and GetX for one reason: testability without BuildContext ceremony. Every health-data calculation in Health3 (unit conversion, reference-range bucketing, trend detection across imports) runs through Riverpod providers that can be unit-tested without instantiating a single widget. For a health app where a wrong number can be actively misleading, this was non-negotiable.
The reactive model also simplified the parse → display dataflow. When a new lab report finishes processing in the cloud, the realtime channel updates the relevant providers, the affected biomarker charts redraw automatically, and the Health Topic deep-dive views recompute their summaries, all through Riverpod's dependency graph, with no manual wiring.
A useful public biomarker library
The public website and the app both need to explain biomarker names, units, and relationships. Reusing a structured dataset can make those explanations easier to maintain. A useful page still needs accurate source material, a clear purpose, and appropriate editorial review.
For unit conversions, one working converter is often more useful than publishing a separate page for every possible number. I would only add a separate page when it explains a distinct ambiguity or task. Page count is not the measure of a useful library.
Translations need review too. A language URL and an hreflang tag do not establish translation quality, medical accuracy, or eligibility to rank.
What this build demonstrates
Health3 brings document processing, structured storage, and an understandable mobile interface into one product. The engineering lesson is to preserve the original data, make every transformation inspectable, and test the full path from an uploaded report to the number shown on a screen.
The public Health3 case study shows storefront screenshots. They demonstrate the product interface; they are not a clinical validation or a claim about client-business results.
The Tech Stack
Flutter, Dart, iOS, Android, Supabase, PostgreSQL, AWS Lambda, AWS API Gateway, AWS Bedrock, AWS Textract, AWS CloudFormation, S3, CloudFront, Mixpanel, GitHub Actions.
Want to discuss a document workflow for your own product? Get in touch. A custom pipeline is scoped around the documents, data controls, and user flow you actually need.